 python生成线性调频信号
# python生成线性调频信号
雷达脉冲信号常用线性调频方式,以利用脉压技术提高距离分辨率,如何产生一个指定脉宽、带宽的线性调频信号呢?这里用到了chirp函数。
def chirp(t, f0, t1, f1, method='linear', phi=0, vertex_zero=True):
    """Frequency-swept cosine generator.

    In the following, 'Hz' should be interpreted as 'cycles per unit';
    there is no requirement here that the unit is one second.  The
    important distinction is that the units of rotation are cycles, not
    radians. Likewise, `t` could be a measurement of space instead of time.

    Parameters
    ----------
    t : array_like
        Times at which to evaluate the waveform.
    f0 : float
        Frequency (e.g. Hz) at time t=0.
    t1 : float
        Time at which `f1` is specified.
    f1 : float
        Frequency (e.g. Hz) of the waveform at time `t1`.
    method : {'linear', 'quadratic', 'logarithmic', 'hyperbolic'}, optional
        Kind of frequency sweep.  If not given, `linear` is assumed.  See
        Notes below for more details.
    phi : float, optional
        Phase offset, in degrees. Default is 0.
    vertex_zero : bool, optional
        This parameter is only used when `method` is 'quadratic'.
        It determines whether the vertex of the parabola that is the graph
        of the frequency is at t=0 or t=t1.
1
2
3
4
5
6
7
8
9
10
11
12
13
14
15
16
17
18
19
20
21
22
23
24
25
26
27
28
2
3
4
5
6
7
8
9
10
11
12
13
14
15
16
17
18
19
20
21
22
23
24
25
26
27
28
入口函数如下:
if __name__ == '__main__':
# 采样率 MHz
fs = 245.76
# 调制脉宽 us
width = 10
# 调制带宽 MHz
band = 20
# 载频 MHz
f_carrier = 50e6
# 生成载波
T = int(width * fs)
t = np.linspace(-width / 2 * 1e-6, width / 2 * 1e-6, T, endpoint=False)
carrier = np.exp(1j * f_carrier * 2 * np.pi * t)
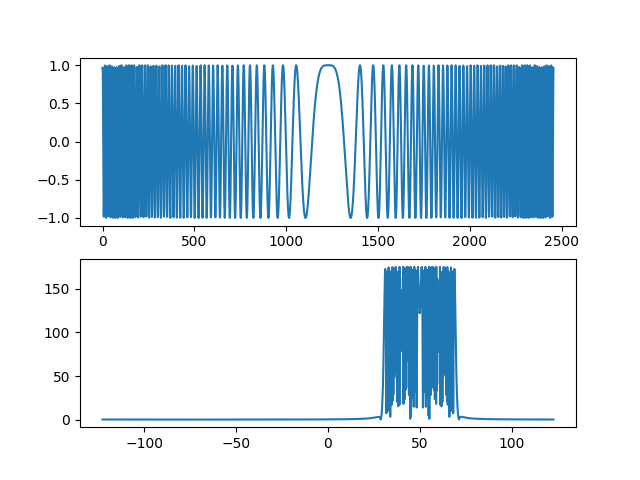
pulse = chirp_pulse_gen(width, band,fs)
plt.subplot(2, 1, 1)
plt.plot(pulse[0])
data = pulse[0] + 1j * pulse[0]
fft1 = cal_fft(data * carrier, fs)
plt.subplot(2, 1, 2)
plt.plot(fft1[0], fft1[1])
1
2
3
4
5
6
7
8
9
10
11
12
13
14
15
16
17
18
19
20
21
22
23
24
25
2
3
4
5
6
7
8
9
10
11
12
13
14
15
16
17
18
19
20
21
22
23
24
25
线性调频信号生成、FFT频谱代码:
from scipy.signal import chirp, spectrogram
import numpy as np
import matplotlib.pyplot as plt

# 线性调频脉冲信号生成
# width 脉宽(us), band 带宽(MHz), fs 采样频率(MHz),pos 默认线性递增
def chirp_pulse_gen(width, band, fs, pos=True):
    T = int(width * fs)
    t = np.linspace(-width / 2 * 1e-6, width / 2 * 1e-6, T, endpoint=False)
    if pos:
        f0 = 0
        f1 = band * 1e6
    else:
        f0 = band * 1e6
        f1 = 0

    I = chirp(t, f0, t[-1], f1, method='linear', phi=0)
    Q = chirp(t, f0, t[-1], f1, method='linear', phi=90)
    return [I, Q]


# FFT
def cal_fft(signal, fs):
    fft1 = np.fft.fft(signal)
    fft_shifted = np.fft.fftshift(fft1)
    # 计算频率轴
    freq = np.fft.fftfreq(len(signal), 1 / fs)
    freq_shifted = np.fft.fftshift(freq)
    return [freq_shifted, np.abs(fft_shifted)]
1
2
3
4
5
6
7
8
9
10
11
12
13
14
15
16
17
18
19
20
21
22
23
24
25
26
27
28
29
30
2
3
4
5
6
7
8
9
10
11
12
13
14
15
16
17
18
19
20
21
22
23
24
25
26
27
28
29
30
上次更新: 2024/08/26, 14:11:22